

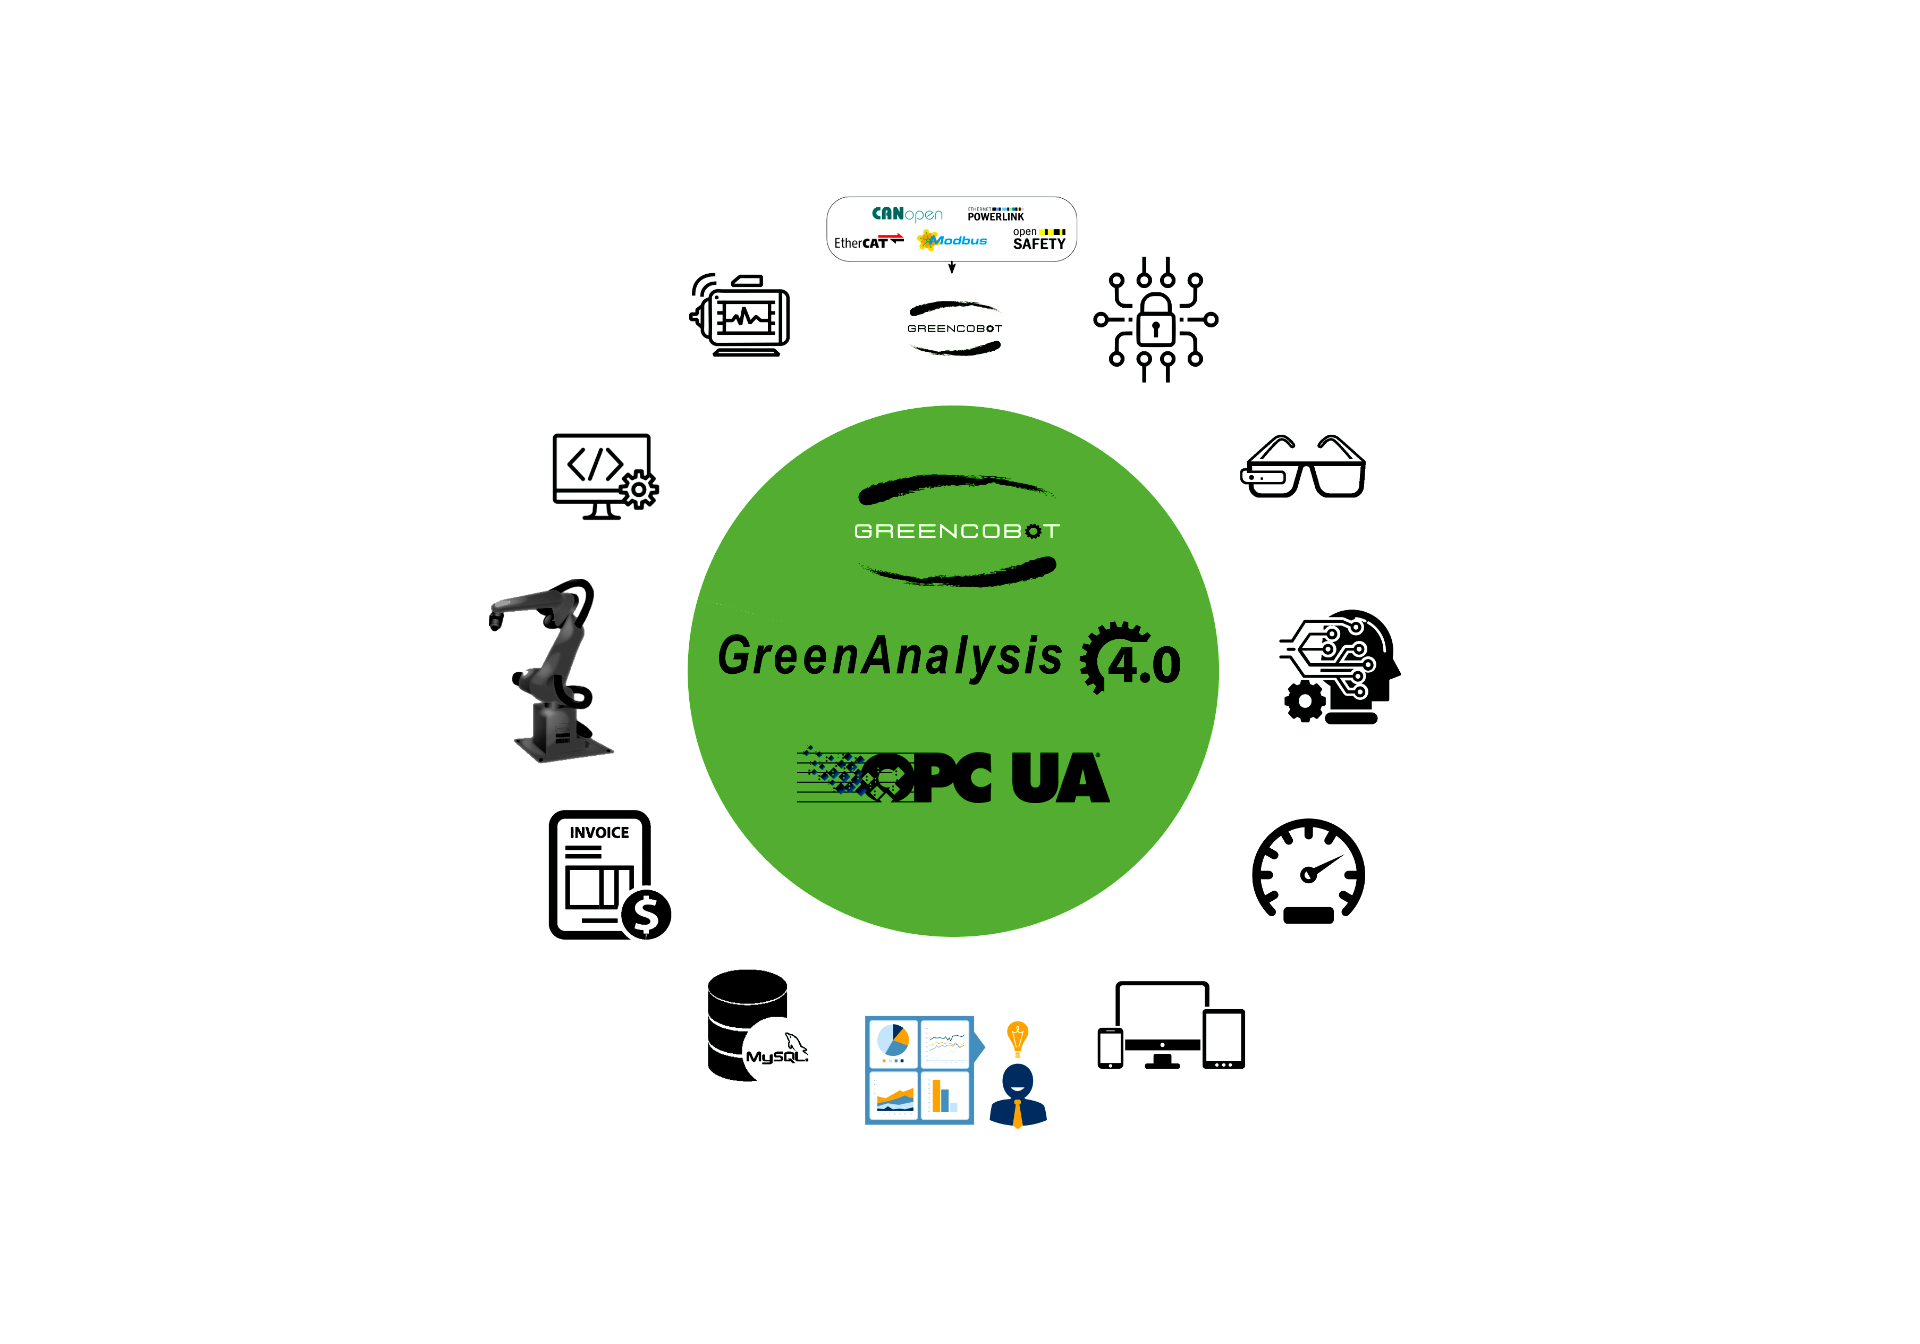
GreenAnalysis is a software that creates interconnection between existing machines, line sensors and management systems. It's able to perform data analysis, business intelligence and secure connections between field BUS, OPC-UA client / server and himself. GreenAnalysis is also a system consisting of hardware suitable both for communication with industrial BUS, and for the creation of server or client structures.


The solution created by GreenAnalysis allows you to use the existing corporate administrative management: it is therefore well suited for all those cases in which the corporate management is not suitable for the new 4.0 regulations and the costs for any implementation of the same are excessive. GreenAnalysis collects, filters, sends and processes data in real time and is the ideal link between production and management macchari in offices; allows the timely management and organization of data and, without having to face a major investment, concretizes one of the fundamental requirements for accessing the tax credit for capital goods introduced by the italian Budget Law 2020.

GreenAnalysis is OPC UA server / client, and processes the data obtained from the various systems in order to provide normalized and selected data to a MySQL interchange database, created by the program itself. The collected data are included in the various management and / or production statistics documents. Databases can be encrypted if needed.

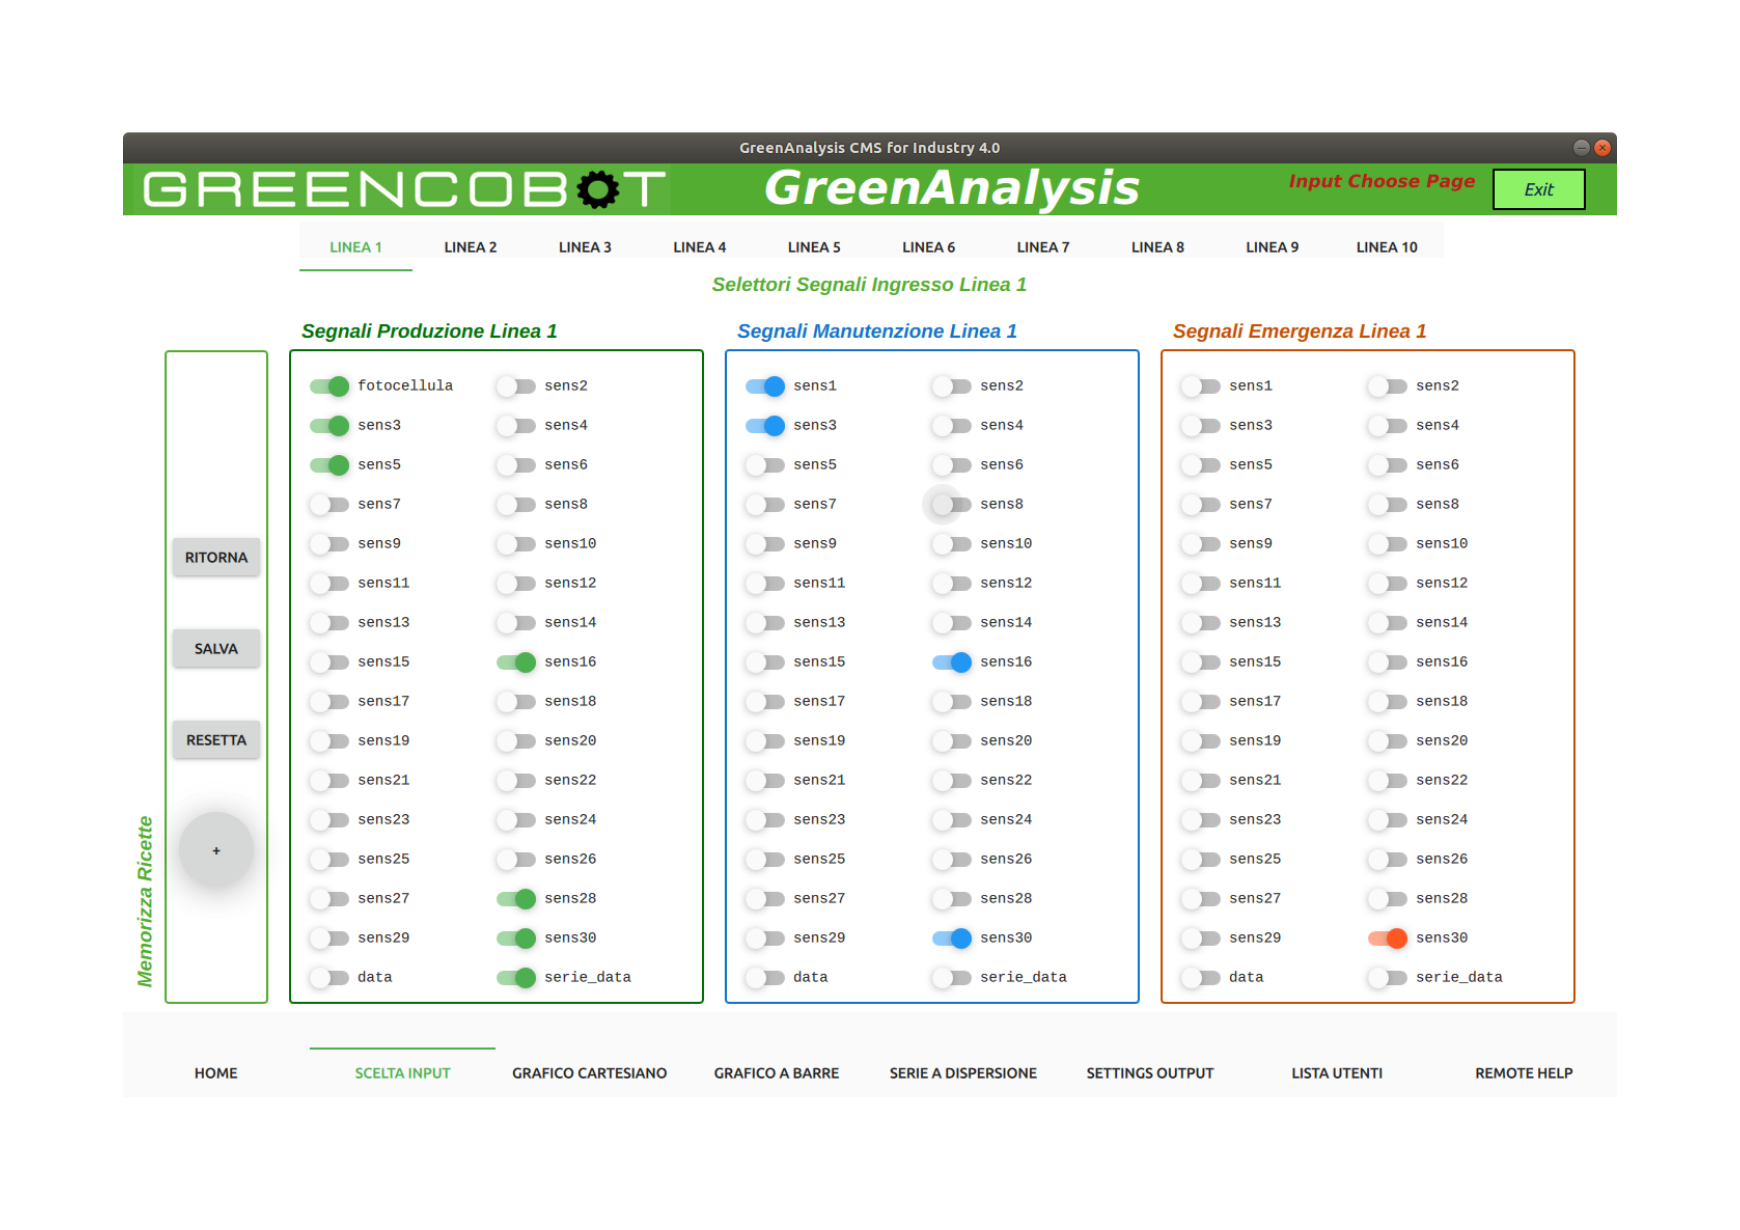
The GreenAnalysis software is widely customizable both in the standard version (being able to choose from a wide variety of data analysis) and in the custom version, where in particular graphics and customized Business Intelligence operations are available. In the standard version, GreenAnalysis controls up to 10 lines / machines and for each line / machine it is possible to choose up to 96 input signals, 30 of which are immediately visible on the graph.

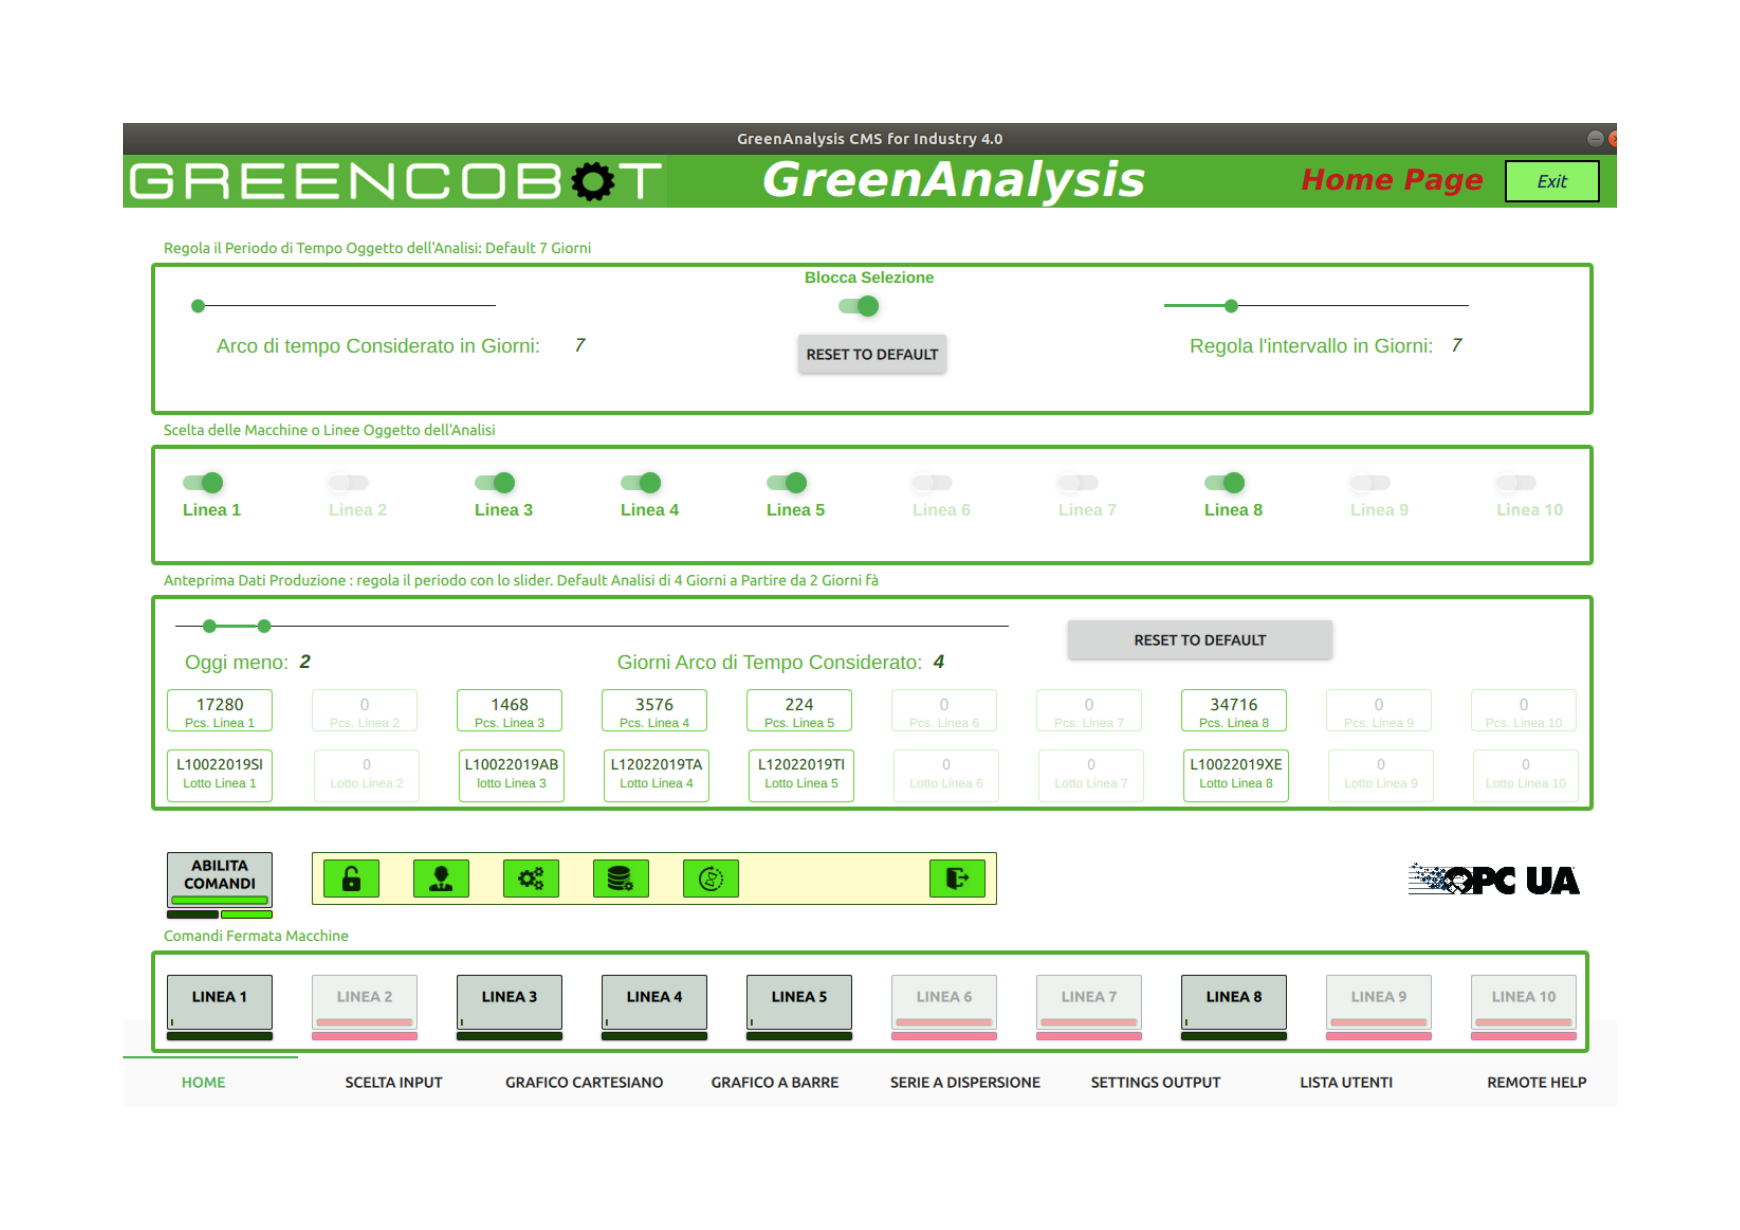
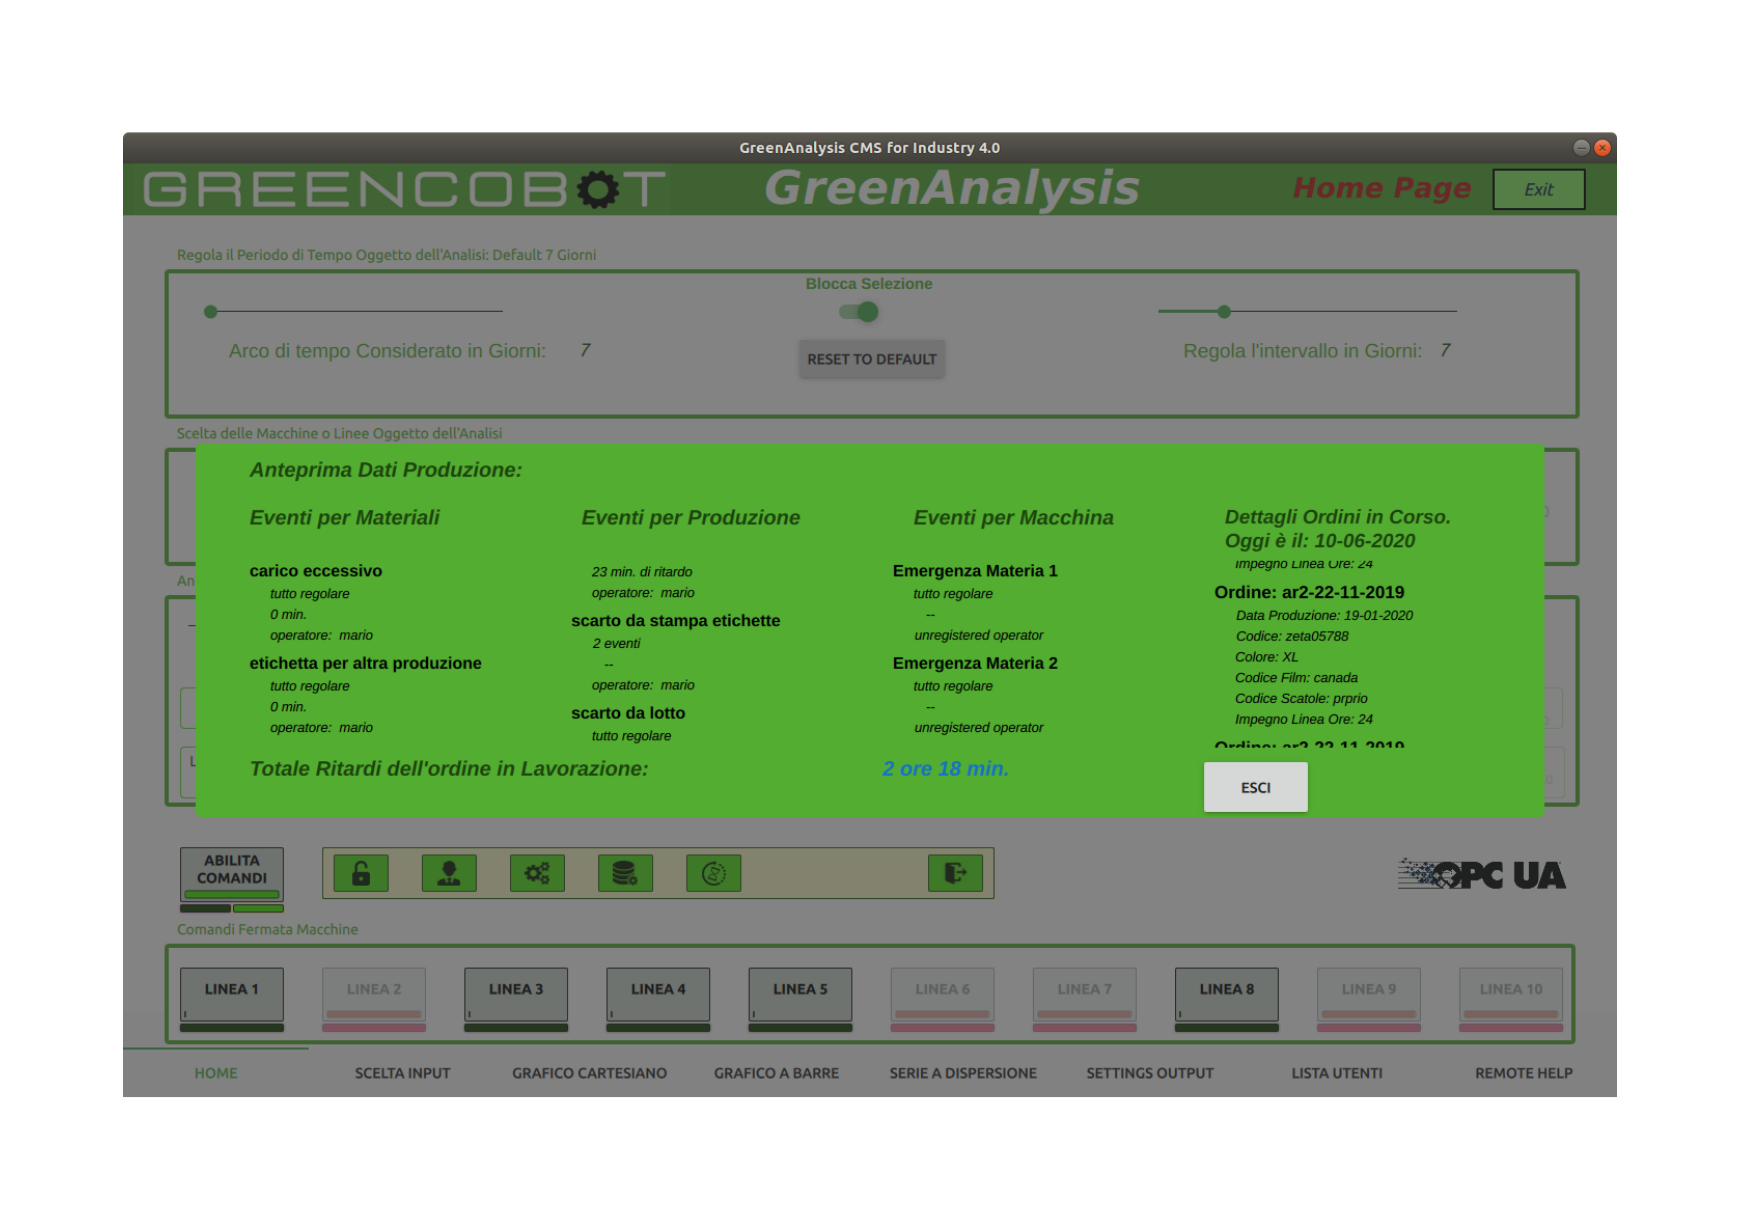
The software provides users with a complete dashboard for supervision and display of the main production data in real time, allowing the line / machine manager to control production from both their desktop and mobile workstations (in the mobile version, only display). The dashboard allows basic line / machine controls (in the standard version only controlled shutdown and controlled start commands are provided, while in the customized version, any type of command is allowed within the perimeters of the safety regulations).

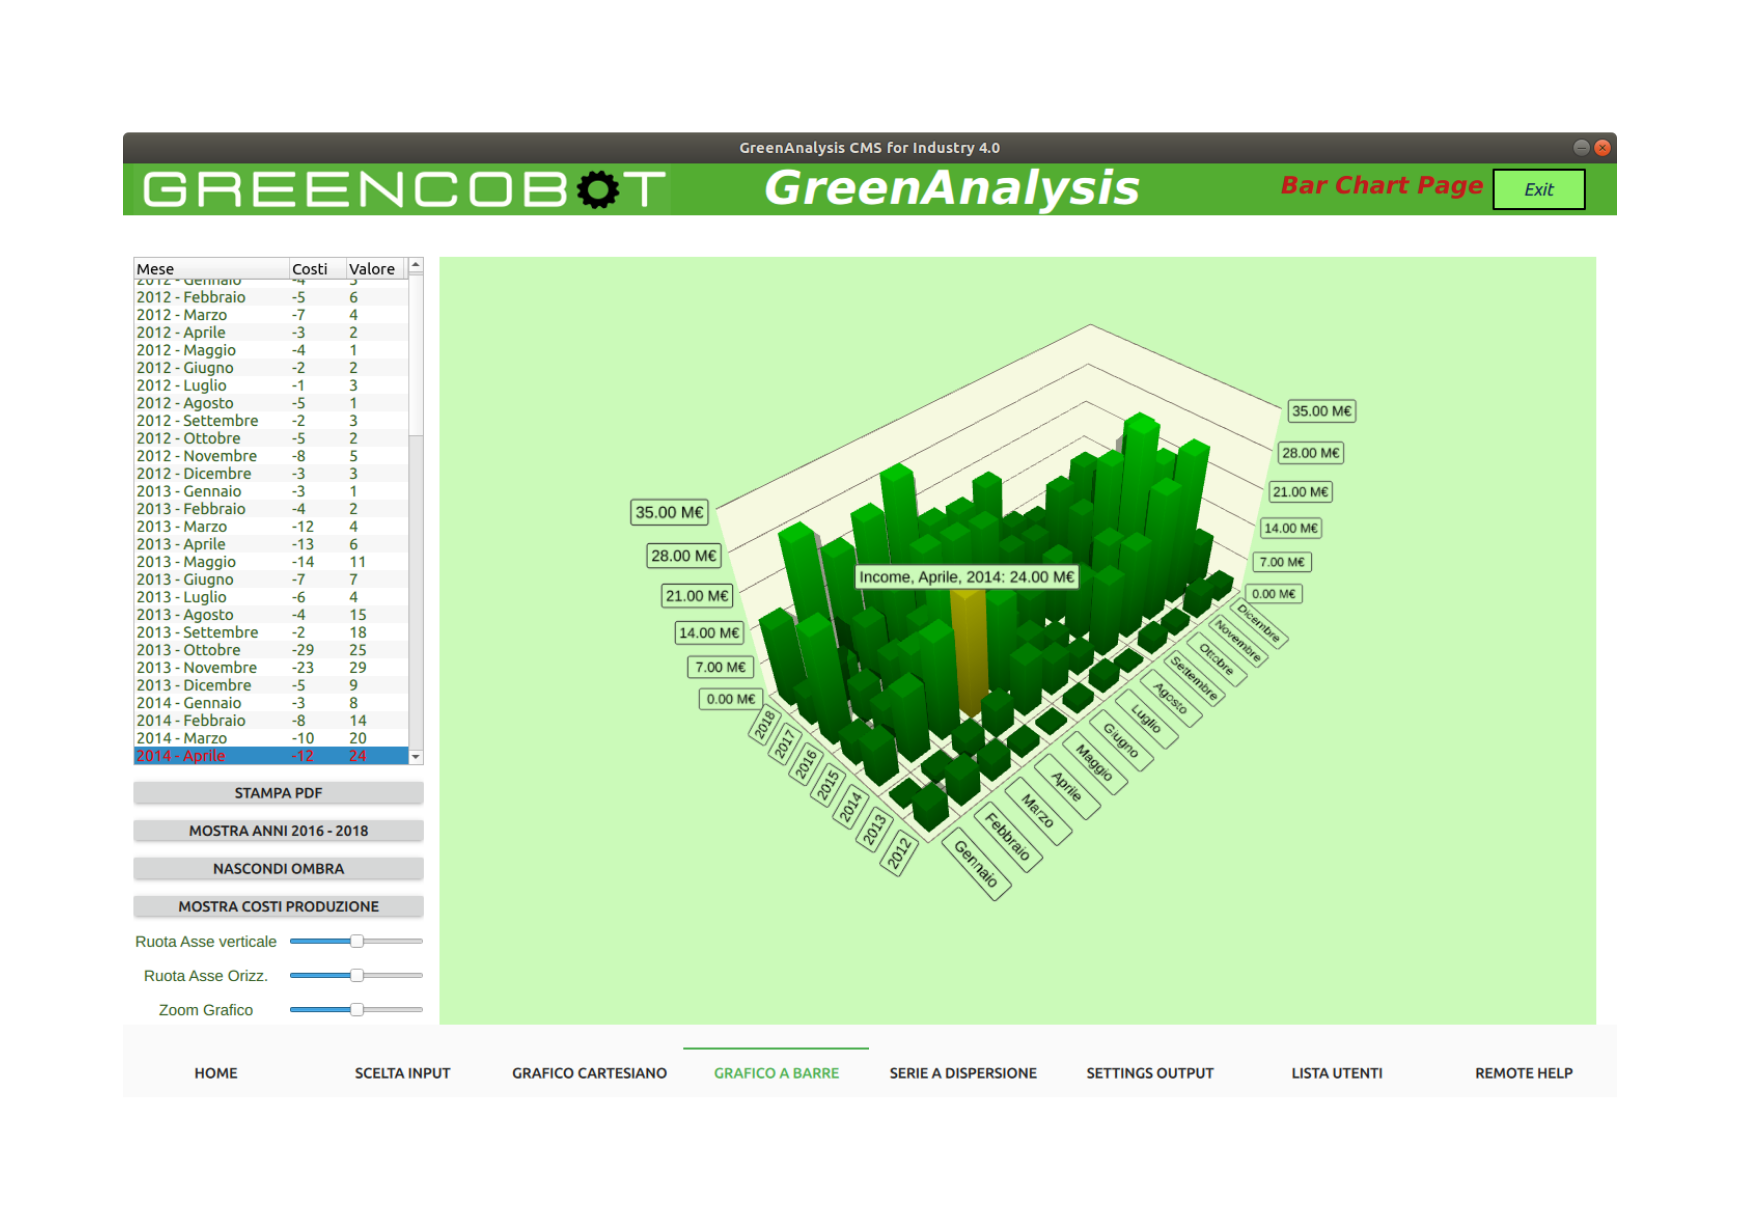
With business intelligence, it is possible to select which period to be analyzed, from the present day up to the previous 3 years, the active lines and the analysis period of the preview, which can go from the present day up to 60 previous days. In the preview you can also see the productions in the unit of measurement programmed according to the selected period and, through a pop-up window, you can view the main events of today, as well as the orders being processed and those scheduled for the next processing . The window is therefore a "glance" on the real-time status of the systems. For an even more complete analysis, Cartesian and 3D graphs of the main production and / or warehouse data can be created.
GreenAnalysis can consist of a standard version or a customized version with more business intelligence features.
GreenAnalysis offers itself as the ideal solution for those who are bound by obsolete software for 4.0 and limited budgets.
GreenAnalysis can be installed on fixed and mobile devices (Android 6.0 and above, via GreenAnalysis-Mobile).
-
User management with system access permissions;
-
Line / machine trend previews panel, with list of events, accumulated delays and subsequent workable orders;
-
Panels choice of sensors that must be "captured" by the system;
-
Panels with Cartesian graphical display of the single selected Inputs;
-
Choice of various types of graphical analysis;
-
Customizable with any type of 3D or 2D chart on request and according to the input data;
-
Printing of charts for export;
-
Automatic correspondence of the data in the graph in question and the data table;
-
Choice of data to send to the MySQL interface database with the management systems used by the customer;
-
System access management with encrypted security keys;
-
Multi-user management;
-
Remote assistance with secure remote access also in video chat or instant messaging direct to GreenCobot assistance.
- Industrial Pc GreenCobot srl (IPC-GC);
- 24dc power supply with power bus;
- 4 PoE (Power Over Ethernet) slots;
- 2 Ethernet / Fieldbus Master slots;
- 2 subD RS485;
- 4 USB3;
- 1 DVI;
- 2 pcie expansion slots;
- 8 inputs (GPIO);
- 8 outputs (GPIO);
- 8 trigger (GPIO);
- I5 / I3 7th Gen processor;
- 120Gb SSD;
- RAM 8Gb 2333Mhz;
- Silent forced ventilation;
- Connection to existing machines via: modbus (TCP / IP - RS485 / RS232 serial), opcUA, canopen (optional), ethercat (optional), powerlink (optional).
- Types of expansion modules -
- From electrical cabinet with 16 + 16 DI / DO slave Ethercat;
- On the machine IP67 for direct wiring on circular M12: 16 DI / DO programmable connectors.
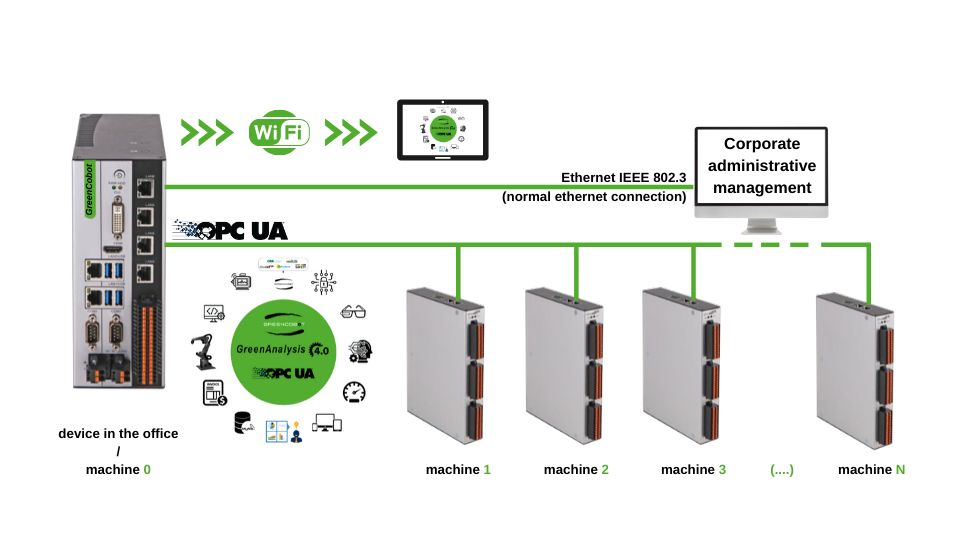
1. Near the lines / machines (fieldbus area) the data is taken from the lines / machines and then processed;
2. Data collection is carried out by dedicated GreenCobot hardware that can be connected to existing machines with the main field buses of your choice between Ethercat, Canopen, Modbus (rtu, tcp), Powerlink, openSafety and of course OPC UA. Even if the machine lacks adequate electronics, the problem can be easily solved by installing suitable sensors connected in "plug & play" mode to the GreenCobot device (there are no pre-established connection limits);
3. A first processing of the data is therefore carried out which are sampled in real-time, stored and developed to be served according to a time-base chosen by the user;
4. In the next step, or in the office in the normal case, another GreenAnalysis device must be installed: this device goes to receive all the data collected by the various machines connected via the fieldbus and makes them available to the user interface. The data, according to the logics programmed from time to time, are output on MySQL database available to the company management which can then query it at will using a normal ethernet connection as the communication channel. The data then arrive in the office on the OPC-UA fieldbus but are transmitted to the management system with a common ethernet connection, via the server-client connection between the GreenAnalysis PC and the company server.
5. The GreenAnalysis PC in the office, in addition to transmitting the data to the company server, can transmit it to the cloud, while the GreenAnlysis PC on the machine can transmit data directly on GreenAnalysis-Mobile devices via Wi-Fi, allowing constant monitoring.